
Sylvie Marchand
I learned the game on the south coast, half-watching Ligue 1 and the Italian sides that drift across the border, and what fixed my attention was rhythm rather than result. From Cannes I saw too many matches where the side leading at the interval lost the points by full time, and it rewired how I think — a match isn't one outcome, it's two halves with a hinge in the middle, and the real question is when the thing actually turns. Half-time/full-time is among the most misread markets there is, which is exactly its appeal. My work centres on how teams open — the fast starters, the slow burners, the sides that fade after the hour — and on how a coach's in-game instincts reshape the second half through substitutions and a change of shape. I watch closely for fixtures where one side habitually comes from behind, because that recurring pattern is where this market hides its edge. A correct outright pick can still be the wrong HT/FT call entirely. Ten years writing this has made me wary of how one early dismissal or a freak opener can tear up the whole script. So I lean on tempo patterns and squad habits, quote prices I believe are fair, and walk through the reasoning step by step rather than pretend I can time the chaos to the minute. — Sylvie Marchand
Pages by Sylvie Marchand 8
Level at Half-Time: How 0-0 and 1-1 Games Finish at Full Time
When a match is 0-0 at half-time, 38.4% end drawn. See how the score, goals line and favourite shape the full-time result in level HT/FT games.
Read the study →
Draw/Draw HT/FT Bet: How Often It Lands and Where to Look
Draw/Draw HT/FT landed in 15.7% of European league matches, and in 23.0% when the draw was priced under 3.00. Where to look, and what price to demand.
Read the study →
HT/FT in the Süper Lig, Greece and Scotland's Lower Leagues
Super League Greece finishes Draw/Draw 19.4% of the time, well above Europe's main leagues. An HT/FT study of Turkey, Greece and lower Scotland.
Read the study →
HT/FT Stats for the Championship, League One and League Two
Draw/Draw lands in 16.2% of Championship matches against 13.6% in the Premier League. A full HT/FT breakdown of England's five divisions.
Read the study →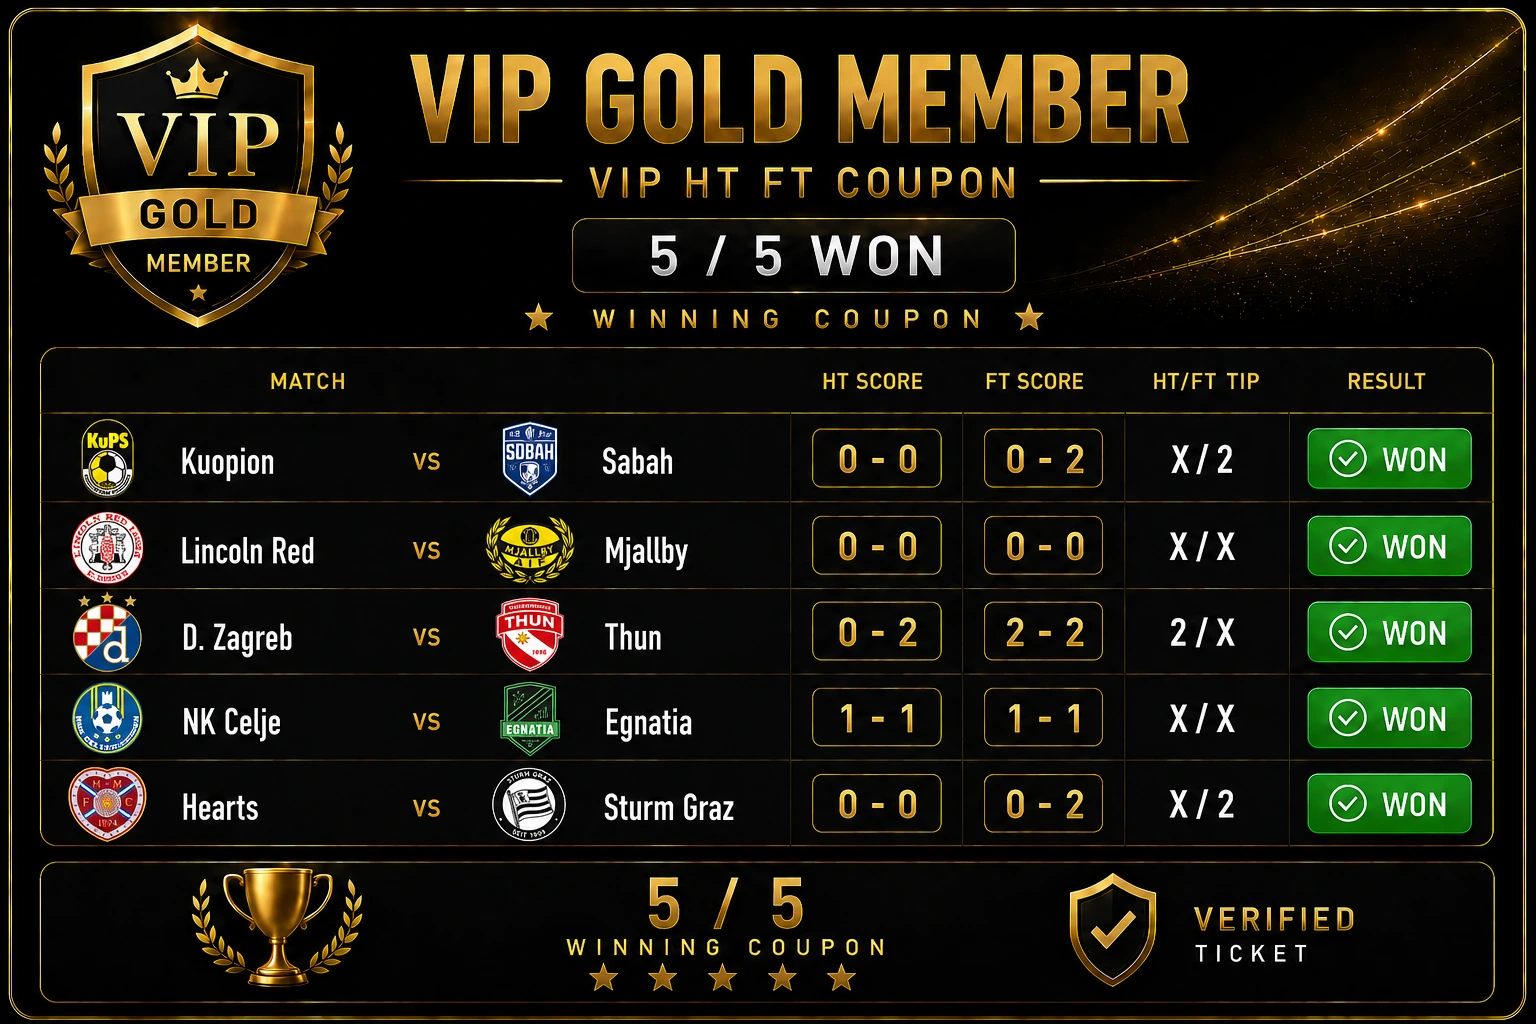
HT/FT With No Clear Favourite: How All 9 Results Are Split
When neither side is shorter than 2.30, Draw/Draw lands 18.1% of the time, fair odds 5.52. How all 9 HT/FT results split in evenly matched games.
Read the study →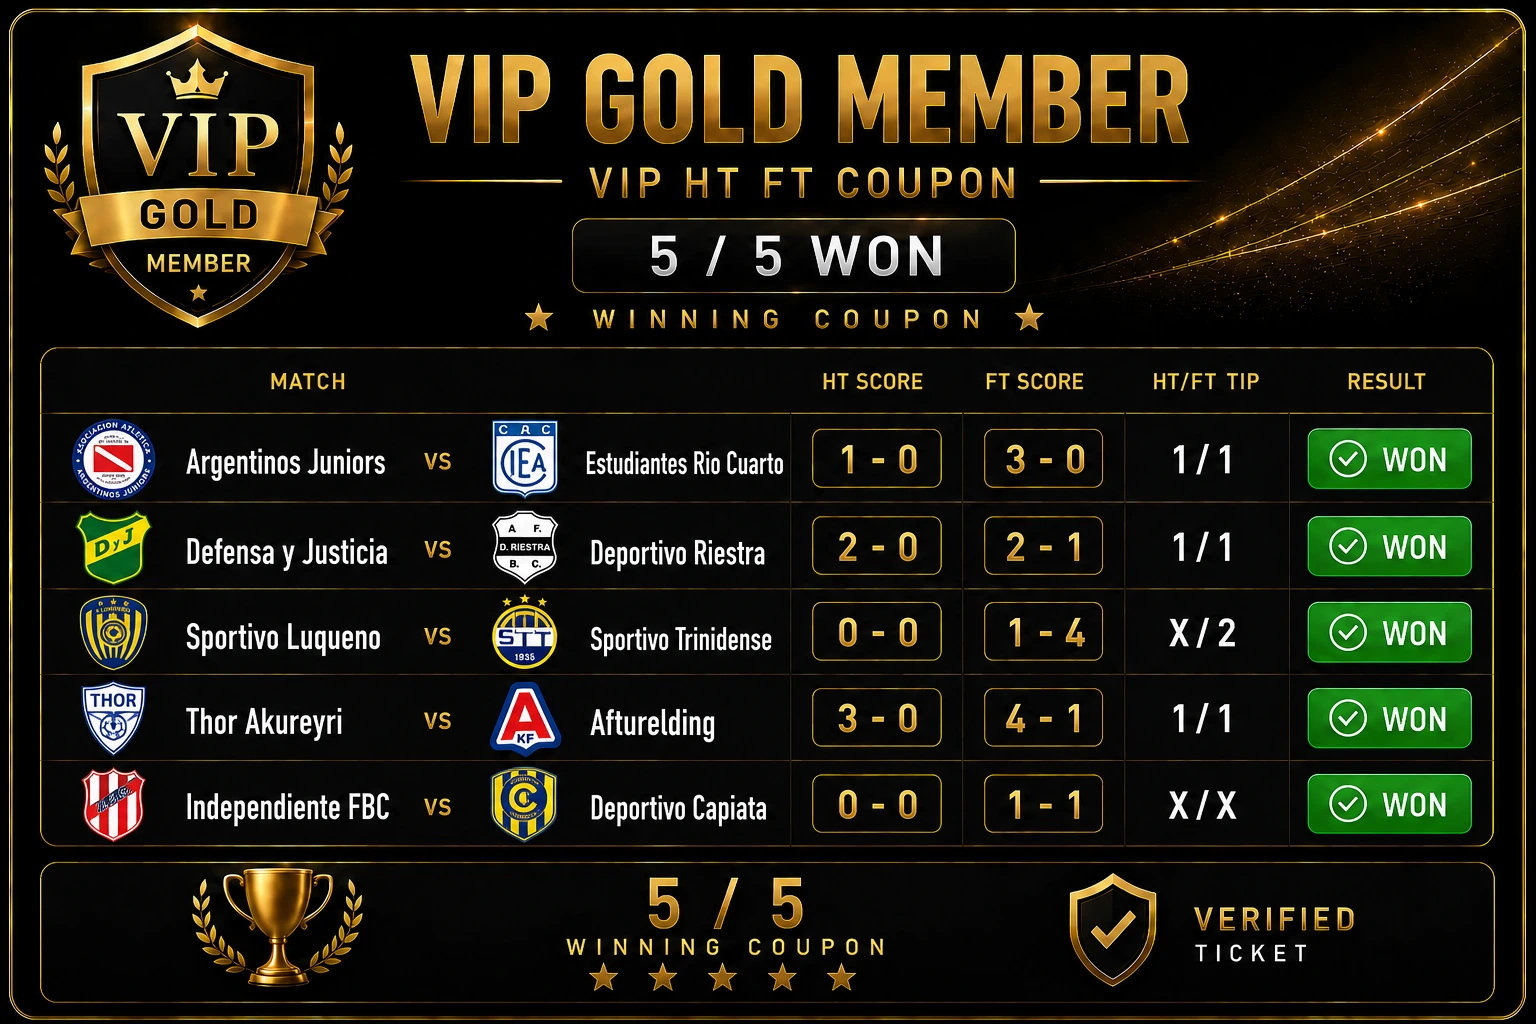
HT/FT When the Away Team Is Favourite: How Each Result Lands
Across 22,660 matches with an away favourite, Away/Away lands 51.2% when the visitors are under 1.40. How every HT/FT result lands at each price.
Read the study →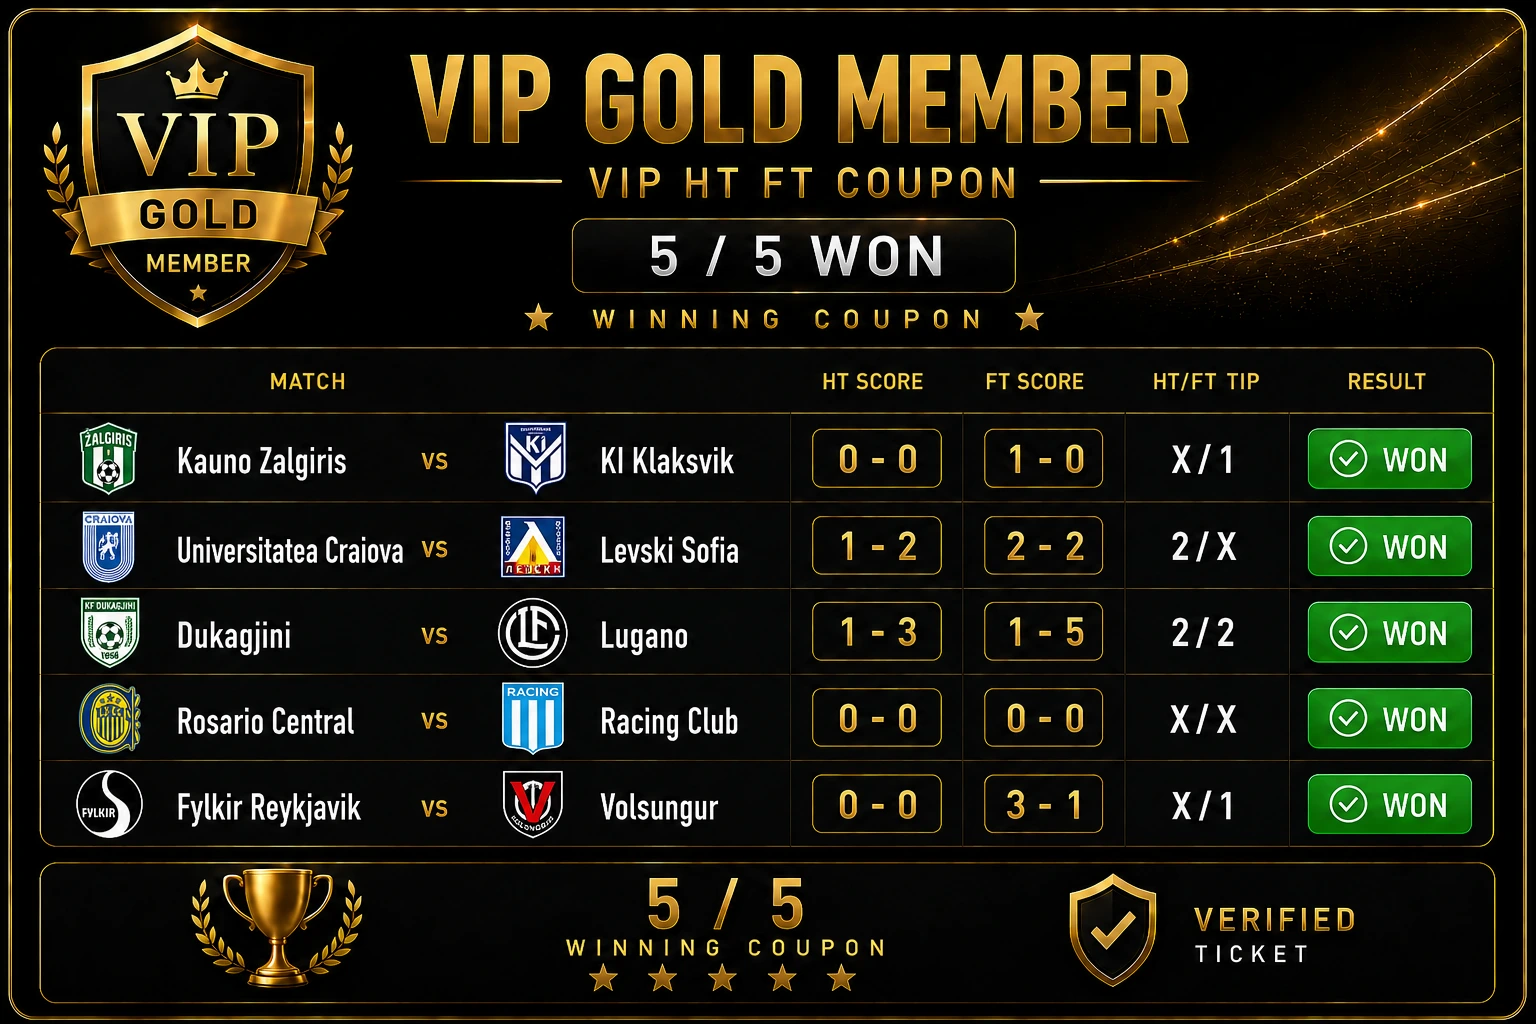
HT/FT for Home Favourites: All 9 Results by Price Band
Across 52,386 home favourites, Home/Home lands far less often than the win itself. All nine HT/FT results and fair odds by price band.
Read the study →
Half Time / Full Time Tips
HT/FT predictions built on how teams start, finish and shift through a match.
Read predictions →Discover Other Writers
Meet our full team covering specialist football betting markets.
View All Authors →